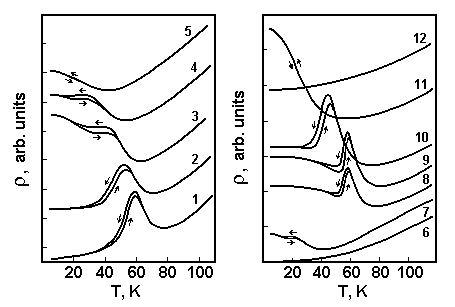
 Figure 1. Typical R(T) plots for
PbSxSeyTe1-x-y and
Pb1-xSnxTe1-ySey solid
solutions. Curves 1-5 correspond to the samples of
PbSxSeyTe1-x-y with constant x=0.08 and
y=0.21, 0.27, 0.34, 0.40, and 0.46, respectively. Curves 6-12 correspond
to the samples of
Pb1-xSnxTe1-ySey with constant
x=0.2 and y=0, 0.05, 0.25, 0.33, 0.5, 0.67, and 0.83, respectively.
The curves are shifted arbitrary along vertical axis. The arrows show the
direction of temperature change during recording of the curves.